In my last post, I told you about my initial results soaking follow-up compounds into preformed HAO1 crystals. In order to generate more crystals (and so more structures), I purified some new protein (I’ll call it ‘batch #2’ for simplicity). However, this second batch, when crystallised, did not take up any of the soaked in compounds and so I set out to find out why. The first indication was in the structure itself which showed that there was much less density for FMN in the second batch (Figure 1D) than in the first (Figure 1C) with the map showing negative (red) density when I placed FMN into its accustomed place.
I confirmed that the second batch was less loaded with FMN by measuring the FMN concentration, relative to protein, in solution by absorbance. As you can see in Figure 1A, the protein peak (at 280 nm) is very similar for both batches but the dual peaks (376 nm and 450 nm) expected for FMN are much smaller in batch #2 relative to batch #1, indicating much less FMN per unit protein. Further investigation also revealed that: a) batch #2 was much less active than batch #1 (Figure 1B, blue/green); b) adding extra FMN did not improve protein activity (Figure 1B, red/purple); and c) soaking of batch #2 crystals with FMN did not improve FMN occupancy in the structures, further supporting that co-factor binding could not be restored in purified protein.
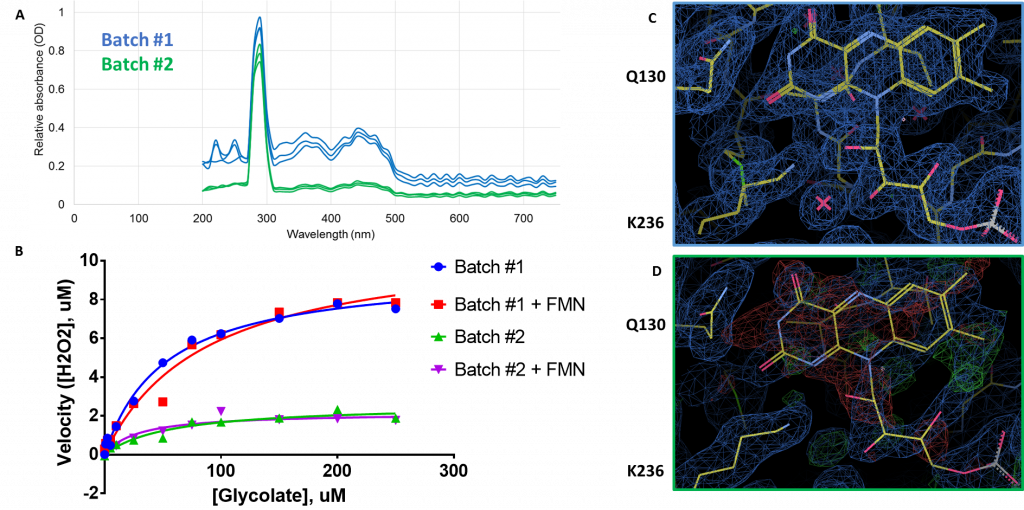
Figure 1: Comparison of FMN content of HAO1 batches. A. Measurement of FMN by absorbance. Protein peak at 280 nm, FMN peaks at 376 nm and 450 nm. B. Measurement of HAO1 assay with and without equimolar (1:1) added FMN. C. Full occupancy of FMN in batch #1 protein crystal. D. Poor occupancy of FMN in batch #2 protein crystal
To explain how a lack of FMN could explain a lack of binding of soaked compounds, I theorised that there must be some changes in flexibility of the gating loop so that in the absence of FMN the loop does not move to allow ligand binding. This theory was initially based on the fact that, unlike previous apo (ligand free) structures of HAO1, the entire gating loop of the batch #2 crystal structures had sufficient density to be modelled (Figure 2B). In previous structures, a fully ordered gating loop was only observed when the loop was in effect ‘locked-down’ by the binding of substrate to batch #1 protein (e.g. PDB code 6GMB; Figure 2C), whereas batch #1 protein crystals without soaked substrate had flexible loops with some residues not able to be built (Figure 2A).
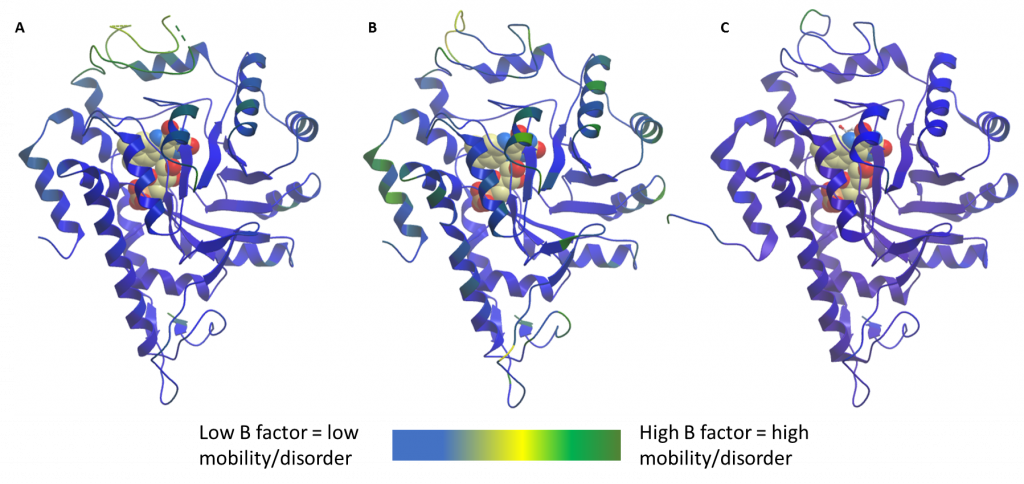
Figure 2: Comparison of loop flexibility of HAO1 structures. A. Batch #1, used for fragment screening. In the absence of substrate, the loop shows high mobility. B. Batch #2, unsuccessful in soaking compounds. Lower mobility loop. C. Batch #1 crystallised with substrate to ‘lock down’ loop. Low mobility loop.
This theory is supported by comparing the B-factors of the loop regions in the different structures. Each atom or group of atoms within a crystal structure is assigned a B-factor which represents the uncertainty in their position dependent on three factors: static disorder, caused by different protein molecules within the same crystal having different conformations; dynamic disorder, representing the movement of the atoms themselves; and coordinate error, attributable to atom(s) that are placed wrongly in the model. A combination of the former two (alongside a minimisation of the latter) gives a good indication of the relative mobility of different protein regions. In this case, we can see from figure 2 that the protein crystals I have used to successfully soak my compounds had highly mobile/disordered loops (Figure 2A, batch #1 without substrate) whereas later structures, from batch #2 (Figure 2B), have much lower b-factors in the loop region. As expected, the least mobile gating loop (lowest b-factors) is found in the structure of HAO1 with substrate (batch #1 with substrate, Figure 2C).