Aside from having high potency towards ACVR1/ALK2, inhibitor compounds ideally should be highly selective and not target other members of the Transforming Growth Factor beta (TGFb) superfamily. TGFBR1/ALK5 is selected for off-target screening because of its potential role in cardiac functions. Firefly luciferase is transcribed downstream of ACVR1/ALK2 in BRE reporter plasmid and downstream of TBFBR1/ALK5 in CAGA reporter plasmid. Renilla luciferase is constitutively transcribed under a weak promoter as internal control.
C2C12 myoblast cell line responds well to ACVR1/ALK2 ligands (eg: BMP7). However, C2C12 does not respond robustly to TGFBR1/ALK5 ligands (eg: TGFb) and result in incomplete and inconsistent IC50 curves. Several legacy ACVR1/ALK2 inhibitors were tested in these DLAs. HEK293 gave robust DLA TGFBR1/ALK5 IC50 curves. The standard deviation among technical triplicates in HEK293 cells is much smaller than C2C12 cells. However, HEK293 cells did not respond to BMP7 stimulation or Activin A stimulation in the presence of ACVR1/ALK2-R206H. Therefore, DLA using C2C12 cells is still necessary for ACVR1/ALK2 IC50 determination.
As an unpleasant surprise, Activin A appeared to have become less potent and induced a smaller response in ACVR1/ALK2 activation compared to previous experiments (3 folds vs 10+ folds). More verification and troubleshooting are needed to determine whether the ligand had expired or other aspects of the assay had gone south.
For experimental details, please refer to Zenodo.
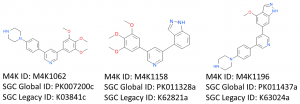
Figure 1. The chemical structures and various identifiers of 3 legacy ACVR1/ALK2 inhibitors that were used for assay benchmarking.
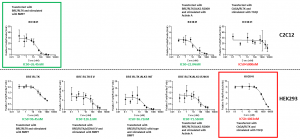
Figure 2. ACVR1/ALK2 and TGFBR1/ALK5 IC50 curves and values for M4K1062 in C2C12 and HEK293 cells. Ideal DLA setup are bracketed in green and red.
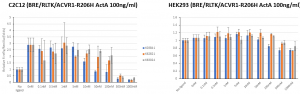
Figure 3. The comparison between DLA readings in C2C12 and HEK293 cells transfected with ACVR1/ALK2 luciferase reporters and ACVR1/ALK2-R206H and stimulated with Acvitin A in the presence of various concentrations of ACVR1/ALK2 inhibitors. Firefly/renilla luciferase ratios were normalised to no ligand control.
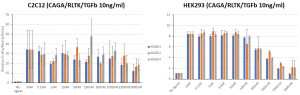
Figure 6. The comparison between DLA readings in C2C12 and HEK293 cells transfected with TGFBR1/ALK5 luciferase reporters and stimulated with TGFb in the presence of various concentrations of ACVR1/ALK2 inhibitors. Firefly/renilla luciferase ratios were normalised to no ligand control.