Purification of proteins for a pull down experiment between XIAP and various type I and type II receptors.
XIAP is known to bind to the kinase RIPK2. RIPK2 is one of the few kinase proteins that shows overlap of reactivity to some of the compounds that we’ve been looking at in the context of ALK2 and other type I/ type II proteins in the BMP/TGFβ families. Therefore we were interested to see if the similarity between RIPK2 and BMP/TGFβ receptors extended into them also binding to XIAP.
That means that, in and around a few other bits and pieces, I’ve been mostly purifying proteins ready for this pull down experiment. All the proteins have a His tag so can be purified by nickel elution to start with followed by gel filtration.
I decided to try and purify the following to begin with: BMPR2, TGFBR2, TGFBR1, ACVR2, BMPR1A and BMPR1B.
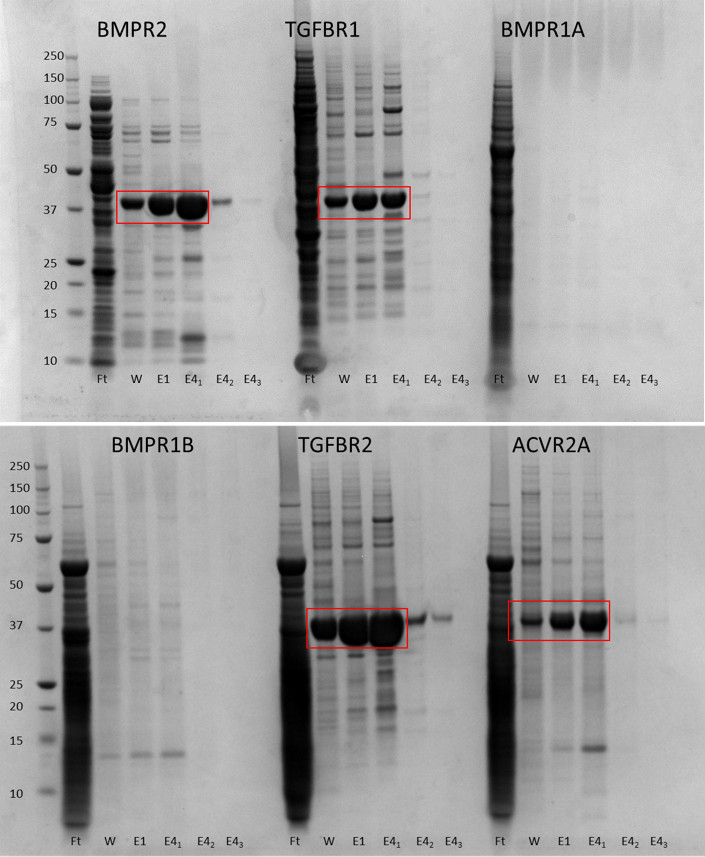
SDS-PAGE gels showing purification of proteins by nickel affinity chromatography.
Nickle purification showed that BMPR1A and B didn’t express so I had to ditch them. I went on to purify the remaining four constructs by size exclusion chromatography (SEC) on either a GF200 or a GF75 column – the only reason for using two different columns was the availability of the machine. The proteins are in a mid-range where either column can be used for second stage purification.
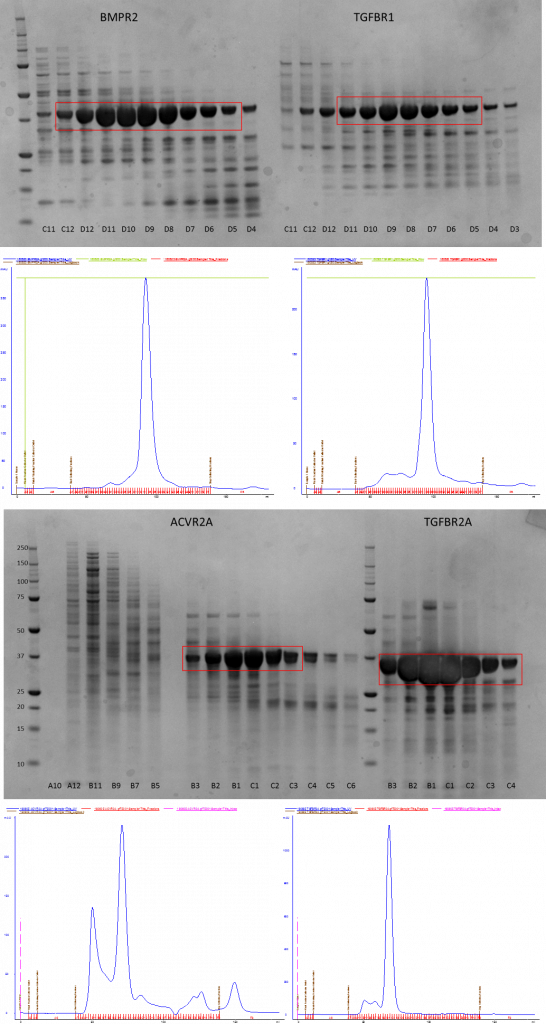
SDS-PAGE gels showing purification of proteins by SEC and the corresponding AKTA traces showing the UV absorbance of all the fractions (blue line)
After this the relevant pure fractions were pooled and concentrated down before flash freezing them ready for use in the XIAP pulldown later on.
You can find details of the purification over at Zenodo.
Tm shift analysis:
The other thing I’ve been working on is a thermal shift or Tm experiment for the ALK2 project. This looks at the change in melting point of a protein as a readout for the binding of a ligand to it. The tighter a ligand binds, the more it stabilises the protein and the higher the shift in the melting temperature will be. As the protein is heated it unfolds; a dye called sypro orange binds to the hydrophobic regions and starts to fluoresce. As more protein unfolds the fluorescence increases and you get more signal from which you can determine your melting point. You can run the experiment in 96 well plates using a very small amount of protein in about 30 minutes. You compare the melting point of the protein alone with the protein + compound and this is called the ‘Tm shift’. It’s a very quick method for getting a qualitative readout on a batch of compounds but doesn’t provide any quantitative data.
I set up a compound plate containing all the M4K Pharma compounds we’ve received so far, from which we can run multiple Tm shifts using whatever protein we’re interested in. I ran one plate using ALK2 as my target protein and two plates using RIPK2 as my target protein. The results showed some compounds with high Tm shifts which might be of interest but the differences between the two RIPK2 runs was quite high, suggesting that something might have gone slightly wrong with the setup (pipetting errors can happen) or the machine or the dye. I’m going to have to repeat these experiments and see if I can get a more reliable set of answers before drawing any firm conclusions.
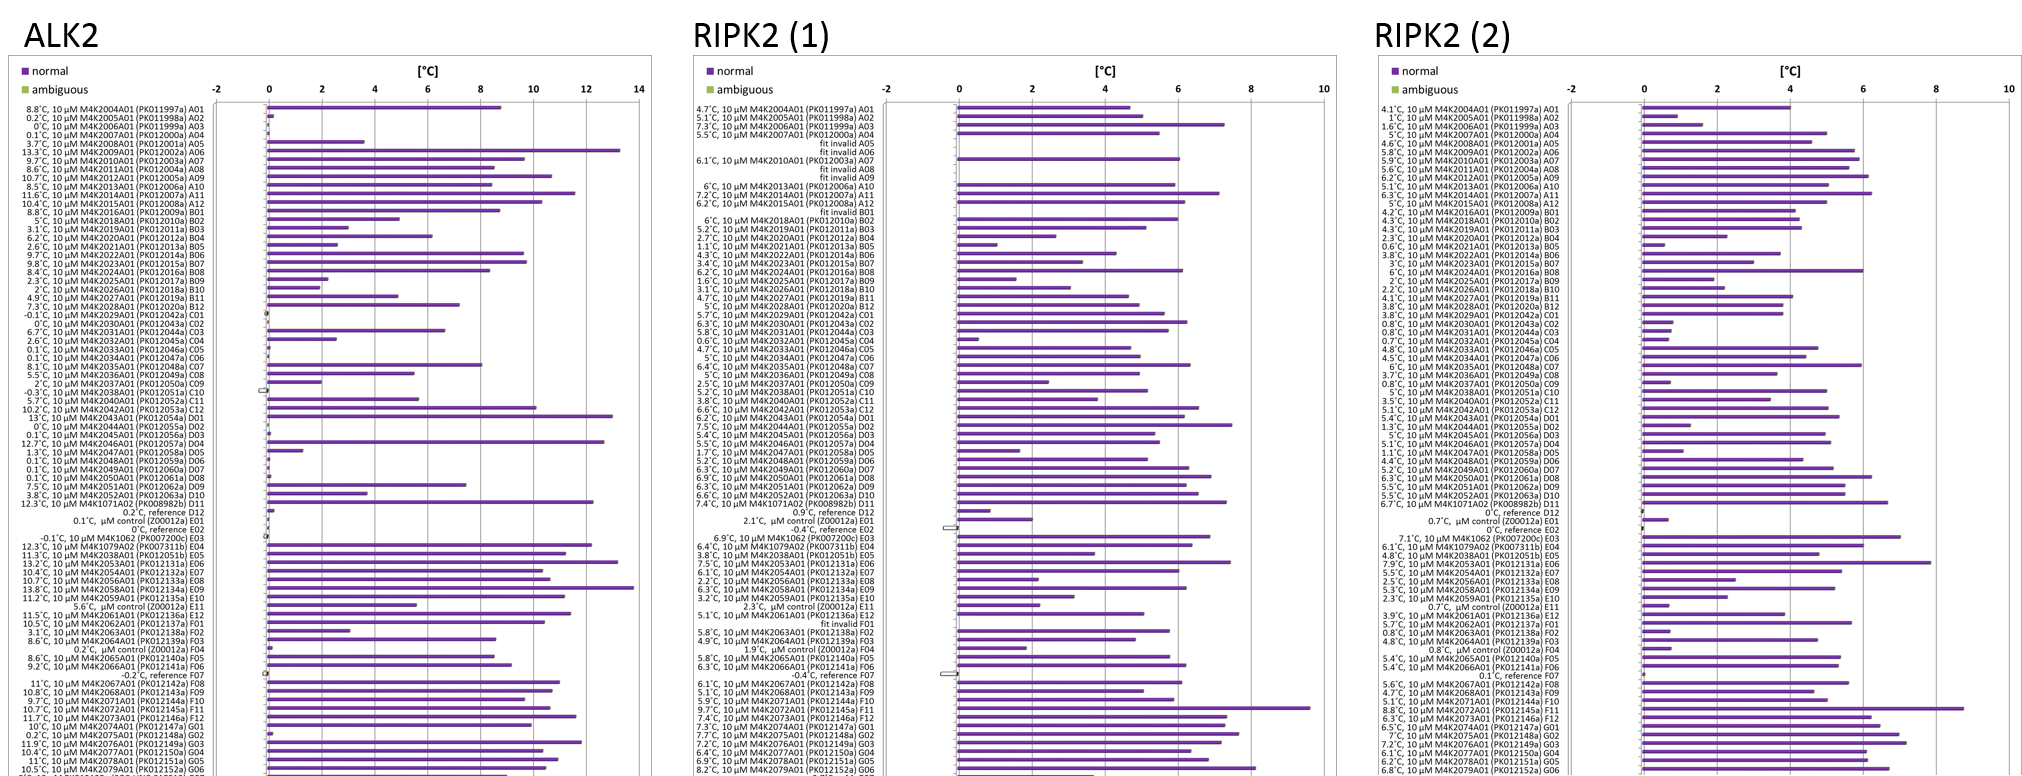
Tm shift analysis shows some compounds giving a good shift suggesting good binding, however variability in readings between runs is too high so repeats necessary.
You can find details of the Tm shift over at Zenodo.