The experimental set-up and results covered in this post can be found here: 10.5281/zenodo.1253365.
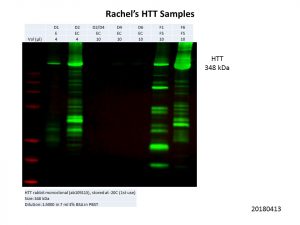
Recently, I helped run some Western blots for Rachel Harding, a fellow postdoc and open notebooker at SGC (read more about her work here: http://labscribbles.com/), for a publication on a toolkit to enable people to more easily purify and study HTT (you can read a draft of the manuscript here: https://zenodo.org/record/1194724#.Ws9pli7wapp). The samples I ran were purified protein of different HTT constructs, D1 to D6, and have different numbers of Q repeats as follows:
D1: 23 Q repeats
D2: 54 Q repeats
D4: 79 Q repeats
D6: 145 Q repeats
As these are purified HTT proteins, we cannot use the BCA assay or a housekeeping protein to normalise the samples, so I manually adjust the volumes of protein loaded for the Western blot. Unfortunately, after normalisation, although clear bands can be seen in all samples, the D4 and D6 transduction samples were still fainter compared to the other samples. Rachel thus provided me with fresh samples with higher concentrations of protein to run the gels with.
For the first batch of samples, I started off running equal volumes of each construct just to see how the relative concentrations were like across the samples, but I’ve since realised that generally, the larger constructs express much more poorly. I thus loaded a smaller volume of protein for the smaller constructs AND used the concentrated eluates (EC) of the larger constructs from the get-go.

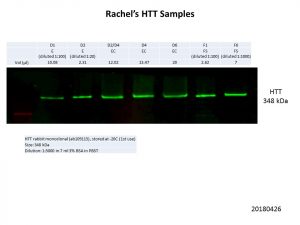
Not as bad as my first run with the first batch of samples, but still lots of normalisation to do. After several rounds of quantification of the bands, dilutions and normalisation of the loading volumes, this was the final run.

The signal for this second batch of samples was much better than that of the first batch. The D1, F1 and F6 samples still had to be diluted down by quite a bit, even when using the unconcentrated eluate, but clear even bands can be seen in all samples.
