NSD3 is located on a region of chromosome 8 (8p11-12) that is frequently amplified in several forms of cancer. It has been suggested that NSD3 (WHSC1L1) may be a driver of tumorigenesis in this context (Mahmood et al. 2013). However, it is still unclear how amplification of NSD3 contributes to the disease and whether or not it is a good candidate for targeted therapy.
Given the phenotypes I have observed in lung cancer models, I was interested in using publically available lung cancer patient data from the Cancer Genome Atlas (TCGA) to try exploring this question.
In an earlier analysis (full details + code here), I found that amplification of NSD3 was more commonly associated with squamous cell cancer than adenocarcinoma (Figure 1a). Next, looking at gene expression data, I found that amplification of NSD3 leads to increased expression levels, supporting the possibility of NSD3-driven downstream events in the context of 8p11-12 amplifications. I also looked at patient survival as well as mutational profiles of these tumours, finding no significant difference compared to patients that do not have an 8p11-12 amplification (Figure 1d-e).
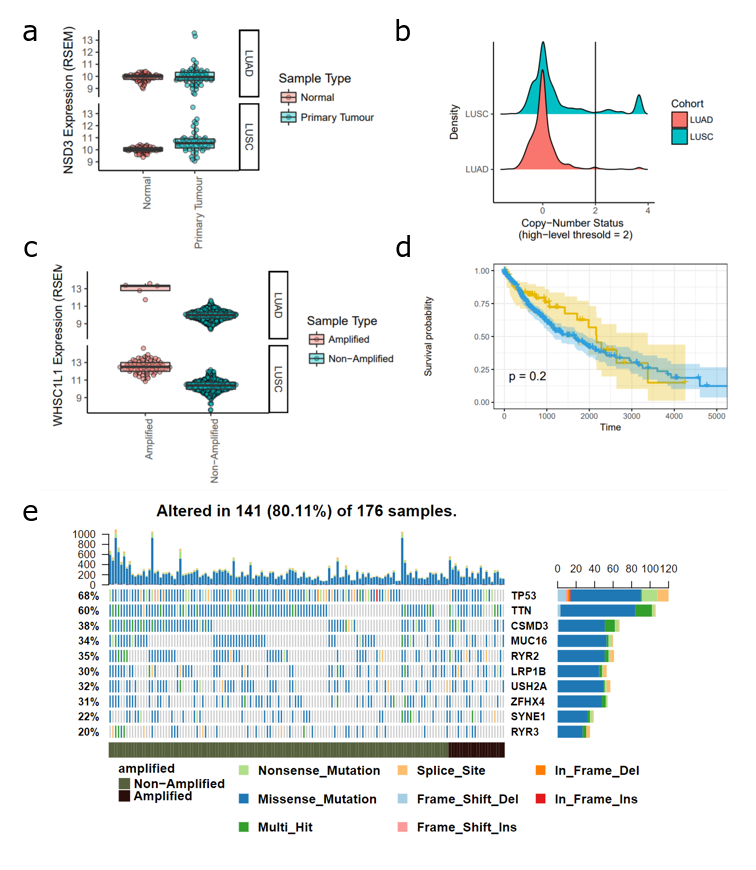
Figure 1. Analysis of NSD3 Amplification in Lung Adenocarcinoma (LUAD) and Lung Squamous Cell Carcinoma (LUSC) TCGA Datasets (a) Expression level (RSEM) of NSD3 in normal versus tumour samples (b) Histogram of NSD3 copy-number status. A value greater than 2 indicates high-level confidence that the gene is amplified. (c) NSD3 expression levels (RSEM) in amplified versus non-amplified samples. (d) Survival curve of patients with an NSD3 amplification compared to non-amplified. (e) Mutational profiles of TCGA-LUSC patients stratified by NSD3 amplification status.
Next, I was interested in how NSD3 amplification may influence gene expression patterns and whether this may reveal a potential susceptibility of 8p11-12 amplified cancers ( See full detail & code on Zenodo). After performing differential expression analysis of amplified vs non-amplified TCGA-LUSC RNA-Seq data, I found that many of the upregulated genes were associated with the 8p11-12 amplicon (Figure 2). There are a number of genes encoded in this region, including chromatin modifiers and assumed oncogenes. Therefore, it is difficult to untangle NSD3-dependent changes in gene expression versus those that may be driven by other gene products originating from this region.
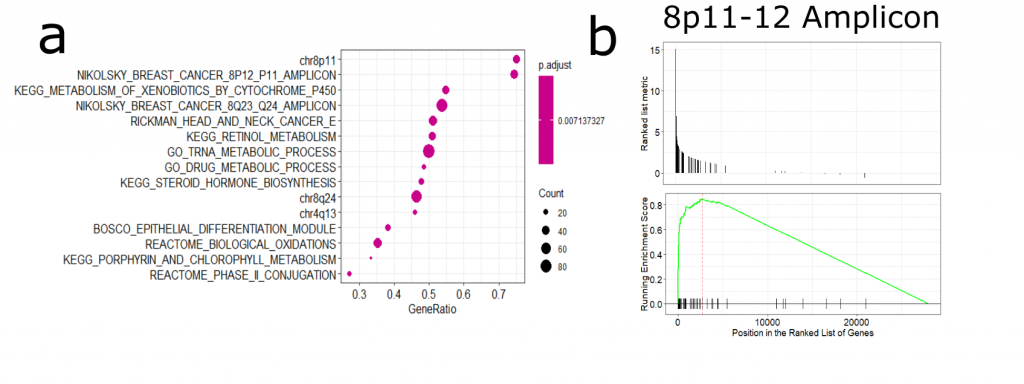
Figure 2. (a) Gene set enrichment analysis of amplified vs non-amplified LUSC gene expression data. We can see an enrichment in genes from the 8p11-12 amplicon (b) GSEA plot of the 8p11-12 gene set.
To focus in on NSD3-associated gene expression profiles, I next took the samples with the highest NSD3 expression (top 20%) and performed differential expression analysis against those with the lowest NSD3 expression (bottom 20%) (Figure 3). Here, I identified significantly more differentially expressed genes than when comparing amplified to non-amplified samples (Figure 4b). I’ve included an interactive plot and table with the results below. Feel free to explore the data, and please let me know if you see something interesting/informative.
I haven’t had time yet to explore this analysis in significant depth. What I have found is that genes that were upregulated in the high NSD3 expressing samples showed enrichment in hedgehog signalling genes and targets of E2F transcription factor. Surprisingly, downregulated genes were actually enriched in EMT factors. This observation is in disagreement with my hypothesis that NSD3 promotes EMT. At this point is difficult to interpret the significance of these transcriptional changes and how they may relate to what I’ve seen in my experiments, lots more research and experiments are needed before drawing any solid conclusions from this analysis. It will be helpful to keep this data in mind and revisit it as I move the project forward.
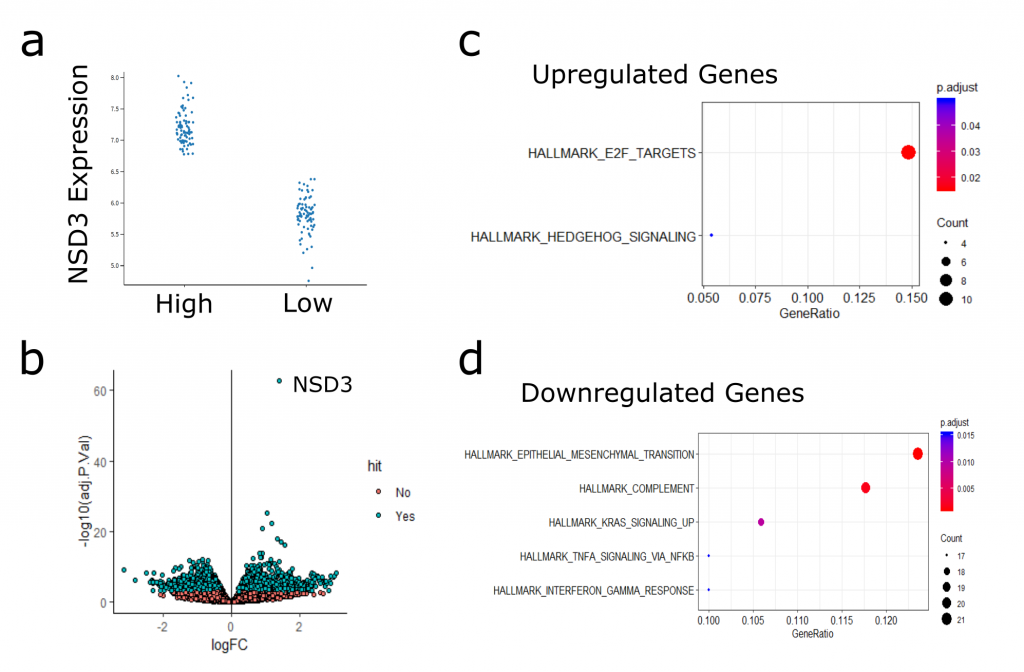
Figure 3. (a) Stratification of Samples based on NSD3 expression. Plot shows h High (top 20%) versus Low (bottom 20%) NSD3 TCGA-LUSC Samples. (b) Volcano plot of differentially expressed genes comparing high-low NSD3 samples. (c) Hallmark MSigDB gene sets enriched in upregulated genes (c) and downregulated (d).
Acknowledgement. This analysis relies on several amazing & open R packages, which are cited below in no particular order. Additionally, the results shown here are based upon data generated by the TCGA Research Network.
References:
- Mahmood SF et al. (2013). PPAPDC1B and WHSC1L1 are common drivers of the 8p11-12 amplicon, not only in breast tumors but also in pancreatic adenocarcinomas and lung tumors. Am J Pathol. 2013 Nov;183(5):1634-1644. doi: 10.1016/j.ajpath.2013.07.028
- Weinstein JN, Collisson EA, Mills GB, et al. The Cancer Genome Atlas Pan-Cancer Analysis Project. Nature genetics. 2013;45(10):1113-1120. doi:10.1038/ng.2764.
- Martin Morgan, Valerie Obenchain, Jim Hester and Hervé Pagès (2017). SummarizedExperiment: SummarizedExperiment container. R package version 1.8.1.
- BioMart and Bioconductor: a powerful link between biological databases and microarray data analysis. Steffen Durinck, Yves Moreau, Arek Kasprzyk, Sean Davis, Bart De Moor, Alvis Brazma and Wolfgang Huber, Bioinformatics 21, 3439-3440 (2005).
- Antonio Colaprico, Tiago Chedraoui Silva, Catharina Olsen, Luciano Garofano, Claudia Cava, Davide Garolini, Thais Sabedot, Tathiane Malta, Stefano M. Pagnotta, Isabella Castiglioni,Michele Ceccarelli, Gianluca Bontempi Houtan Noushmehr. TCGAbiolinks: An R/Bioconductor package for integrative analysis of TCGA data Nucleic Acids Research (05 May 2016) 44 (8): e71. (doi:10.1093/nar/gkv1507) Mario Deng (2016). FirebrowseR: An ‘API’ Client for Broads ‘Firehose’ Pipeline. R package version 1.1.35.
- Hadley Wickham (2017). tidyverse: Easily Install and Load the ‘Tidyverse’. R package version 1.2.1. https://CRAN.R-project.org/package=tidyverse
- Guangchuang Yu, Li-Gen Wang, Yanyan Han and Qing-Yu He. clusterProfiler: an R package for comparing biological themes among gene clusters. OMICS: A Journal of Integrative Biology 2012, 16(5):284-287
- Ritchie, M.E., Phipson, B., Wu, D., Hu, Y., Law, C.W., Shi, W., and Smyth, G.K. (2015). limma powers differential expression analyses for RNA-sequencing and microarray studies. Nucleic Acids Research 43(7), e47
- Shian Su, Charity W. Law, Casey Ah-Cann, Marie-Liesse Asselin-Labat, Marnie E. Blewitt, Matthew E. Ritchie; Glimma: interactive graphics for gene expression analysis. Bioinformatics 2017 btx094. doi: 10.1093/bioinformatics/btx094
- Stefan Milton Bache and Hadley Wickham (2014). magrittr: A Forward-Pipe Operator for R. R package version 1.5. https://CRAN.R-project.org/package=magrittr
- Robinson MD, McCarthy DJ and Smyth GK (2010). edgeR: a Bioconductor package for differential expression analysis of digital gene expression data. Bioinformatics 26, 139-140
- Mayakonda, A. and H.P. Koeffler, Maftools: Efficient analysis, visualization and summarization of MAF files from large-scale
cohort based cancer studies. bioRxiv, 2016. doi: http://dx.doi.org/10.1101/052662
David, DCAF12L2 (most up-regulated in NSD3-overexpressing LUSC samples according to your interactive plot) is one of the top 3 E3 ligases with the higher mutation hot-spot ratios in TCGA: https://www.cell.com/cms/attachment/2119332939/2092313773/gr1_lrg.jpg
I don’t want to be over-reading into it, but thought I would pass this on to you.
Thanks Matthieu, an interesting observation to keep in mind. DCAF12L2 expression seems to be on the lower end in these samples. I agree, should be cautious about overinterpreting this type of analysis. Hoping it may be informative to refer back to as I get more results from cellular assays.