In two of my previous posts 5 and 6, I showed how we found the residues lining the catalytic pockets of SARS-CoV-2 SAM-dependent m7GpppA-specific 2’-O-methyltransferase (2’-O-MTase) which I refer to as NSP16.
In this post, I show the energy calculations corresponding to the variants from SARS-CoV-2 patient samples at the catalytic site of 2’-O-MTase. Alongside that, you will see a table that shows all the possible mutations at the catalytic site of 2’-O-MTase and the predicted changes in the endogenous ligand-binding sites due to those mutations.
We wanted to look at the genetic diversity of 2’-O-MTase among SARS-CoV-2 samples from COVID-19 patients. This time, like my previous analysis of the SARS-CoV-2 main protease catalytic site, I sent the 39 residues lining the catalytic site of NSP16 to Nicola De Maio, our collaborator from European Bioinformatics Institute (EBI). He then looked at more than 15000 SARS-CoV-2 samples to find the variants at this site. Below in table 1, you can see the 6 non-synonymous variants that Nicola has identified in his sample batch and the number of each variant at a specific sidechain. For example, at position Ser6896 of NSP16, 15873 SARS-CoV-2 samples have a serine (S) residue while one sample had a leucine (L) residue. Among these 6 positions, residue 6932 is more unstable than the others, with proline found in 15847 samples and serine in 26.
| Non-synonymous variations at NSP16 catalytic site |
| 1) Ser6896 S (15873), L (1) |
| 2) Leu6898 L (15873), F (1) |
| 3) Asp6912 D (15873), G (1) |
| 4) Pro6932 P (15847), S (26) |
| 5) Pro6932 P (15847), T (1) |
| 6) Ser7000 S (15843), F (1) |
Table 1. The non-synonymous variants at NSP16 catalytic site.
Since there is no structure of NSP16 in complex with inhibitors, I evaluated the effect of these mutations on the co-crystallized endogenous ligands SAM and RNA. Chemical inhibitors should occupy the same site, and probably mimic several interactions made by endogenous ligands, which is why we use this structure as a first approximation. But two important things should be kept in mind here. 1: Mutations predicted to penalize SAM or RNA binding will not necessarily penalize the binding of future inhibitors (though they are more likely to). 2: The phosphate linker of RNA is highly flexible and mutations at this site that are predicted to be penalizing may not be so.
To predict the effect of these 6 non-synonymous mutations on the binding of the cofactor SAM and the RNA molecule with the SARS-CoV-2 2’-O-MTase, we predicted the ddGbind values of the mutations in ICM as shown in table 2. The color-coded structure in figure 1 highlights the variants among the SARS-CoV-2 samples at the 2’-O-MTase catalytic site.
| Residue | Residue Number | WT | Mutant | distance to SAM | distance to RNA | Ligand | ddGnind |
| a_6wvn.a/^S6896 | 6896 | Ser | Leu | 4.415 | 11.01 | SAM | -1.082 |
| a_6wvn.a/^L6898 | 6898 | Leu | Phe | 1.918 | 7.847 | SAM | -0.2247 |
| a_6wvn.a/^D6912 | 6912 | Asp | Gly | 1.966 | 12.13 | SAM | 2.362 |
| a_6wvn.a/^P6932 | 6932 | Pro | Thr | 3.064 | 2.586 | RNA | -0.9464 |
| a_6wvn.a/^P6932 | 6932 | Pro | Ser | 3.064 | 2.586 | RNA | -0.1506 |
| a_6wvn.a/^S7000 | 7000 | Ser | Phe | 11.74 | 1.768 | RNA | 56.21 |
Table 2. The energy calculations pertaining to the genetic variants of the SARS-CoV-2 samples at the 2’-O-MTase catalytic site. The ddGbind values are in Kcal/mol.
All the 6 mutations in table 1 were predicted to have minor effects on ligand binding (-2kcal/mol < ddGbind < 2kcal/mol) except for S7000F, which was very penalizing at 56,21 Kcal/mol and D6912G at 2.362 Kcal/mol. Color-coded representation of SARS-CoV-2 NSP16 is shown in figure 1 whereby we highlight the effect of mutations on endogenous ligand-binding (based on ddGbind values) using two colors. Orange color is used to show mutations that result in ddGbind values greater than 2Kcal/mol and green color to show mutations that result in ddGbind values smaller than 2 Kcal/mol.
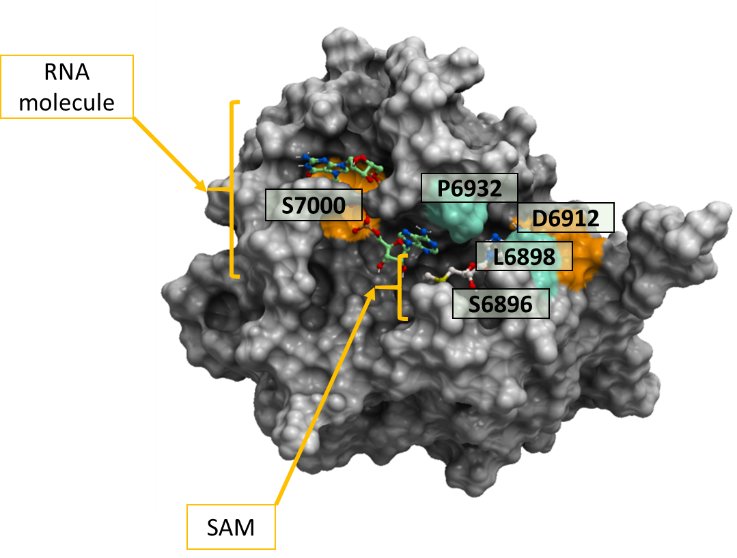
Figure 1. Color-coded representation of SARS-CoV-2 2’-O-MTase (PDB: 6wvn). The colored areas on the mesh show the non-conserved residues across more than 15000 SARS-CoV-2 samples from COVID-19 patients. Both the cofactor SAM and the RNA molecule are labeled on this diagram. The orange-colored residue mutation S7000F and D6912G penalize ligand binding significantly and mildly respectively, while the green-colored residues mutations (S6896L, L6898F, P6932P, P6932S) do not penalize ligand binding significantly.
It is very likely that changing a serine residue to phenylalanine which is a bigger amino acid would result in steric clashes in the RNA-binding pocket of 2’-O-MTase as shown in figure 2. It would also lead to the loss of hydrogen bonds that were originally there between the hydroxyl group of serine sidechain and the oxygen atoms of the triphosphates on the RNA molecule. However, it is notable that the phosphate linker of RNA is flexible and may potentially accommodate the mutation S7000F. D6912G is also expected to disrupt the hydrogen bond between Asp and the amino (NH2) on the adenosine ring of SAM cofactor which is reflected in the value of ddGbind at 2.362 Kcal/mol. It is mild but not negligible. To view the 2-D ligand-protein interactions which I just mentioned here, please view my Zenodo report here.
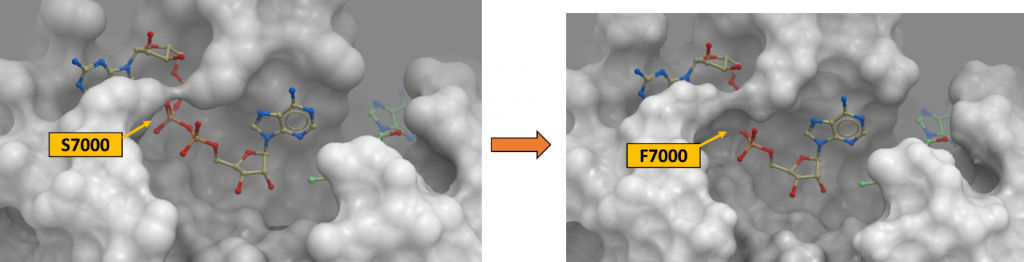
Figure 2. Ser7000Phe variant at the SARS-CoV-2 2’-O-MTase catalytic site (PDB: 6wvn). The channel occupied by the phosphate linker of the RNA molecule is occluded due to the bulkiness of Phe (right panel) that replaced Ser7000 (left panel).
Based on our prediction, the rest of the non-synonymous mutations (S6896L, L6898F, P6932T, P6932S) from other SARS-CoV-2 variants do not penalize ligand binding significantly as they ranged between -1.5 to 1 Kcal/mol. (1) P6932 residue sidechains lie in proximity to the RNA and S6896, L6898 lie in proximity to the cofactor SAM-binding pocket of 2’-O-MTase.
According to the expected effects of the mutations on ligand binding, it would be likely that a broad-spectrum inhibitor should bind to the sidechains of the regions in the green oval in figure 3. We exclude the S7000 sidechain as it is expected that the mutation S7000F from COVID-19 patients would penalize ligand binding greatly.
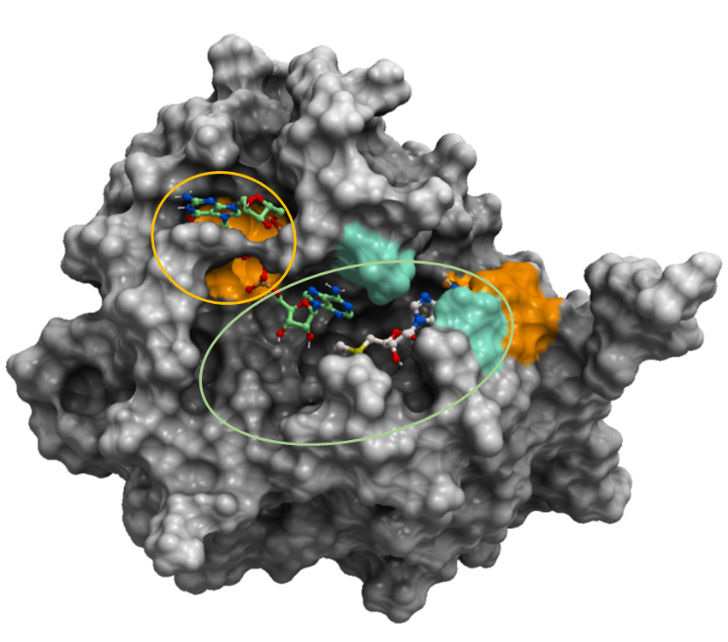
Figure 3. The mesh representation of SARS-CoV-2 2’-O-MTase (PDB: 6wvn). The orange oval shows areas that broad-spectrum inhibitors should avoid. The green oval shows that broad-spectrum inhibitors should occupy. The oval excludes the orange area since based on the expected effects of the mutations of SARS-CoV-2 samples from COVID-19 patients, S7000F is expected to penalize RNA-binding significantly.
In my next post, I will show you how we predict the effect of all possible mutations at the 39 sidechains of the NSP16 catalytic site on SAM and RNA-binding using the ddGbind values.
As always, I would be happy to hear your comments. Please contact me via the “Leave a comment” link at the top of this post. Stay Tuned for more updates on this project.
References:
- Schapira, M., Totrov, M., Abagyan, R. Prediction of the Binding Energy for Small Molecules, Peptides and Proteins. Journal of Molecular Recognition 12(3), 177-90 (1999). https://doi.org/10.1002/(SICI)1099-1352(199905/06)12:3<177::AID-JMR451>3.0.CO;2-Z