In my last post, I showed you the genetic variants at SARS-CoV-2 SAM-dependent m7GpppA-specific 2’-O-methyltransferase (2’-O-MTase). Also, we predicted the effects of SARS-CoV-2 samples mutations on SAM- and RNA-binding to the 2’-O-MTase (NSP16) catalytic site using the change in Gibbs free energy (ddGbind) values.
Next, we wanted to assess the effect of all possible mutations at the sidechains lining the catalytic site of NSP16 and how that would affect RNA or SAM-binding. Table 1 below shows all possible mutations and the ddGbind values corresponding to each. In order to determine the ligand that should be considered for ddGbind calculation, we used the distance function in ICM to measure which of the two ligands (RNA, SAM) is closer to each of the 39 residues lining NSP16 catalytic site. Then based on that selection of the ligand, all possible mutations were modeled in ICM and the change in Gibbs free energy was calculated and is presented in table 1.
It is likely that the residues of the rows with green color are not making optimal interactions with SAM or RNA substrate. This is reflected in the very slight and non-significant lowering in ddGbind values of these residues (mutations are stabilizing) and hence the green color. Inhibitors could potentially make strong interactions (better than SAM or RNA) with wild-type sidechains at these positions. On the other hand, the sidechains whose mutations are shown in orange are likely the positions where 2’-O-MTase would better interact with SAM or RNA. As a result, the mutations of those sidechains are predicted to penalize SAM- and RNA-binding significantly and hence the orange color.
In the absence of structures in complex with inhibitors, the predicted effect of these mutations is on the binding of endogenous ligands. The effect could be different on the binding of future inhibitors, especially if inhibitors do not mimic protein-ligand interactions observed with SAM or RNA.
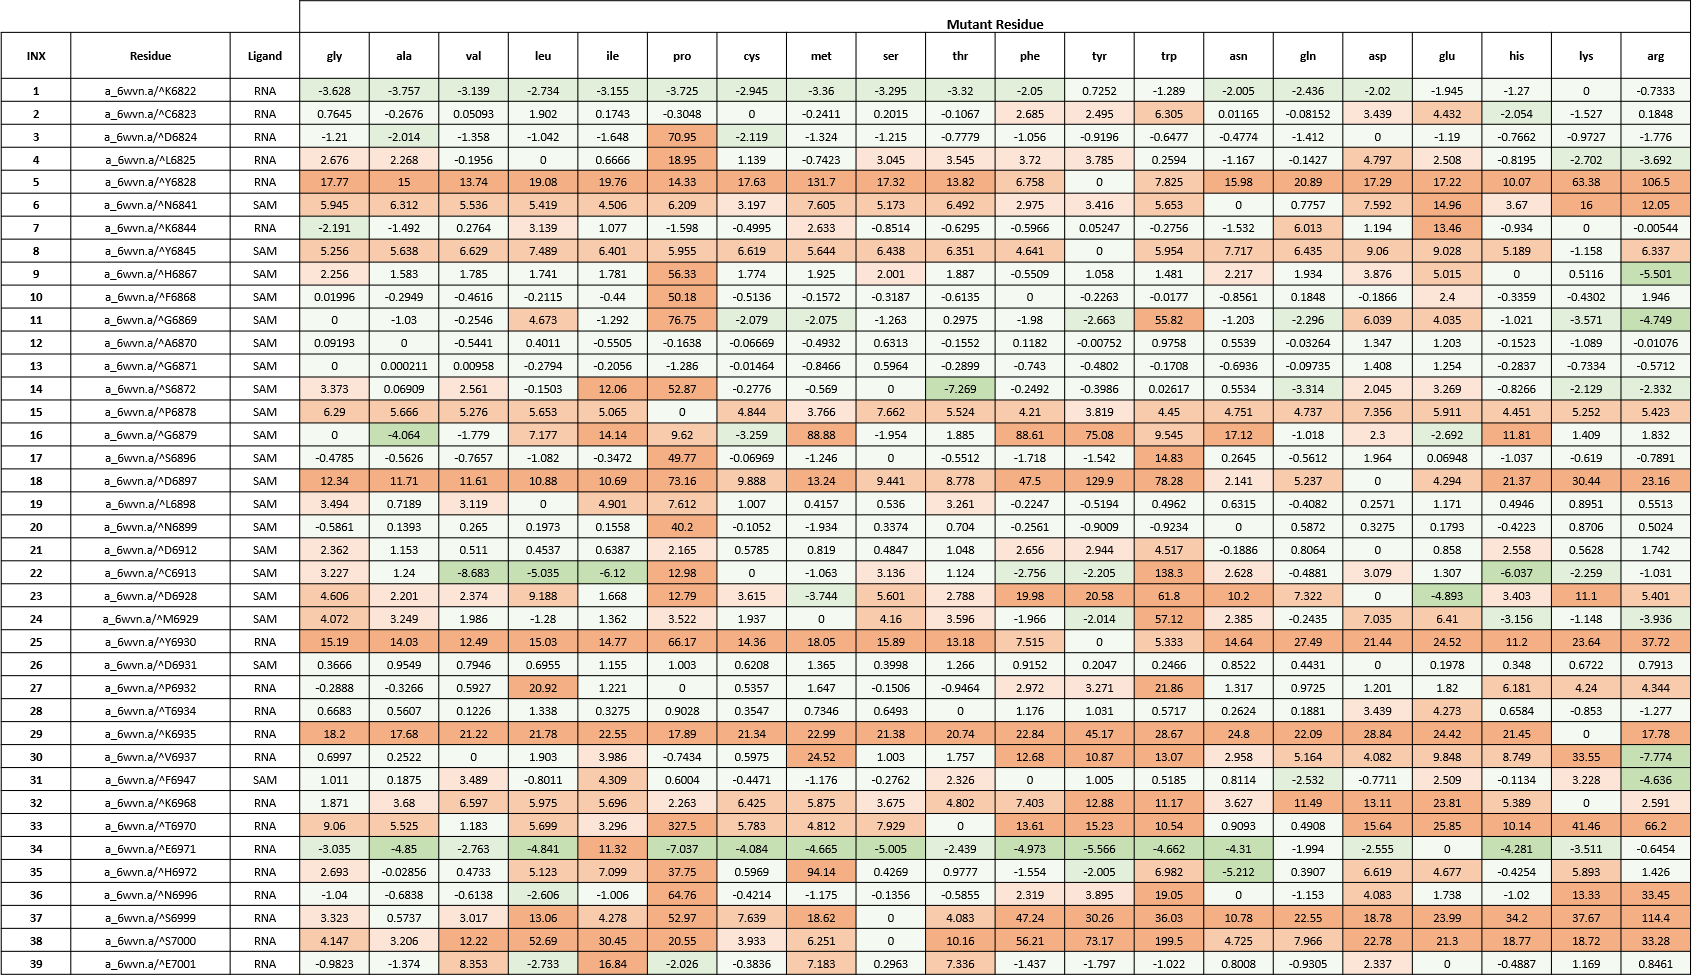 Table 1. The energy matrix of mutations of the 39 residues lining the catalytic pocket of 2’-O-MTase of SARS-CoV-2. The energy unit is kcal/mol. The color-coding of table 1 is shown below.

To see the detailed methods and the script used in ICM for making the energy matrix table, please refer to my Zenodo report here.
As always, I would be happy to hear your comments. Please contact me via the “Leave a comment” link at the top of this post. Stay Tuned for more updates on this project.