Deposition:
In the past two weeks my work has mostly been full of dealing with structures. The first thing I needed to do was deposit some structures of ALK2 co-crystallised with three drug molecules that I had solved for our collaborators Swen Hoelder and Liam Hudson at ICR, who had been developing compounds against ALK2. Once the structures were deposited we could submit the paper associated with them. After a bit of too’ing and fro’ing to get everything sorted, the PDB has now published these structures under the codes 6GIN, 6GI6 and 6GIP.
Determination:
Having got two datasets from the trip last week, the second thing I spent a lot of my time on this past fortnight looking at the data to solve the structures of two novel compounds bound to an ALK2/FKBP12 complex.
The data you get from crystallography is not a direct imaging technique but instead a series of diffraction patterns that have information contained in both the spacing and the intensity of the dots. You need to reverse engineer this information in a sense – mathematically working backwards to determine the structure that created the pattern that you recorded. Luckily much of that mathematical analysis is done by a computer. You also need to solve what’s called the ‘Phase Problem’ which refers to the fact that you record the amplitude of the signal but not the phase and thus lose vital information. To solve this problem you can use a number of different methods, but in this case because we’ve crystallised ALK2 before we can use ‘molecular replacement’ which means using a similar structure and the phases associated with that to find the phases of the new structure.
Once you have the phases, you then end up with a map of electron density to which you can start fitting your model of the protein and the ligand bound to it. Since the reference model you used for the phases isn’t identical to the new structure there are always tweaks you need to make, even if the model is of the same protein. Side chains will have different orientations, the binding pocket will be arranged differently around the ligand and the ligand its self will have an electron density specific to it. If your data is at a high enough resolution then you will also see the pattern of water molecules around the protein, these can be important as they can act as bridging molecules between ligand and protein and provide key information.
Once you have fit your model to the density you then ‘refine’ it which is where the model is adjusted to better fit the density, fine tuning any changes you’ve made manually, as well as trying to fit the model to allowed rotamer and Ramachandran restraints. Then re-phases the original data using the new model so you can improve the phase solution and see whether there is any density unaccounted for by the model (where you might be missing something like a protein side chain or a ligand molecule) or any model where there is no density (perhaps where you’ve miss-fitted a side chain or where a protein loop has moved between your original reference structure and your new structure. You can then correct these and go through the whole cycle of refinement again.
The various statistics and outputs from refinement can be used to work out if your model is physiologically probable and statistically reliable. You have to keep an eye on the statistics of modelling to ensure that your model is not over-fit and to prevent the introduction of bias. In this way you gradually work towards a model that is as close to the true structure as possible according to the data you have available.
In this case my two structures (PK010710 and PK012055) were at 1.5 and 1.7A respectively and so a lot of detail can be seen of the ligand’s position, the protein side chain orientations and the water molecules associated with the protein. The majority of the time is then spent going through every residue (around 400 residues for this construct of ALK2 and 100 for FKBP12) systematically to check that it does the following:
- Fits the density of the experiment so your model reflects the actual situation as best as possible. Sometimes this means cutting back sidechains (or even whole residues) where you can’t see density for the whole sidechain.
- Has reasonable Ramachandran φ and ψ angles that are within the range that is energetically favourable for proteins. It is very rare for peptide bonds to be outside of these known ranges.
- Has reasonable side chain rotamer conformations – again this is due to energetic favourability and it is most likely that side chains will be in some conformations more than others.
- Has all relevant density modelled, such as sufficient water molecules, ligand molecules and other additives (such as chemicals from the crystallisation condition or the cryoprotectant used during mounting).
Once you’ve fixed all the issues and your statistics tell you it’s a good model you have something that you can deposit in the Protein Data Bank (PDB) and use to look for biologically significant differences to previous structures. In this case, each protein took around 8 rounds of refinement and model adjustment to get to a ‘finished’ state.
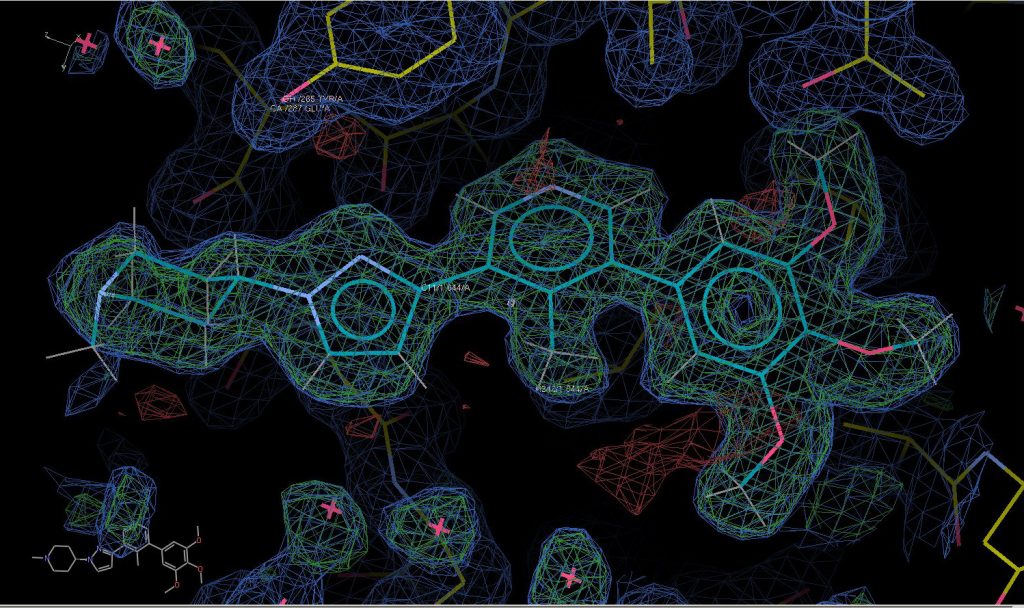
Here is a picture of my workings for PK010710 showing the clear electron density in green mesh around the model of the compound fitted to the data.
You can find details of the data analysis on Zenodo.
These structures now need proofreading by a second independent set of eyes, just to make sure I’ve not missed anything, before I can deposit them in the PDB but it’s unlikely there will be any major changes. Now I can get stuck into comparing them to the other structures we’ve got to try and make sense of what we’re seeing and why these compounds might have the affinities that they do.