In this post I’d like to return to looking at my work on phosphorylation. Phosphorylation is a key signalling method for activating the BMP pathway and inducing activity. Specifically activation of ALK2 by phosphorylation leads to phosphorylation of SMAD1 which leads to gene transcription that ultimately is responsible for bone formation.
In this post I’m going to talk about two experiments – the first is looking at the rate of phosphorylation (or how active) of two ALK2 mutants, L196P and R258S. The second is to look at mapping the exact sites of phosphorylation on two of the more common ALK2 mutations in FOP, R206H and Q027E.
Phosphorylation over time in ALK2 L196P and R258S.
I’ve talked previously about how phosphorylation is effected by the Q207E and R206H mutations in ALK2. This time I wanted to look at some additional mutants that are found in a small proportion of cases of FOP, specifically L196P, R258S, G328E and R375P. I purified the long forms of these ALK2 mutations in a standard fashion. Regrettably only L196P and R258S gave a good yield of expressed protein while the other two constructs gave me no expression of protein. I set up my standard activation assay with these ALK2 mutants (I mixed them with SMAD1 and with either ACVR2 or BMPR2, before adding ATP, DTT and Mg2+/Mn2+ in order to start the reaction), taking samples over time periodically up to 30 minutes. The samples were then analysed by mass spec to look for intact mass shifts corresponding to phosphorylation.
I plotted the peaks corresponding to phosphorylated states of both ALK2 and SMAD1 at the different time points and used this 3D graph to compare different mutant’s behaviour with respect to the activity of ALK2. I also compared this data to previously obtained data from the previous blog post.
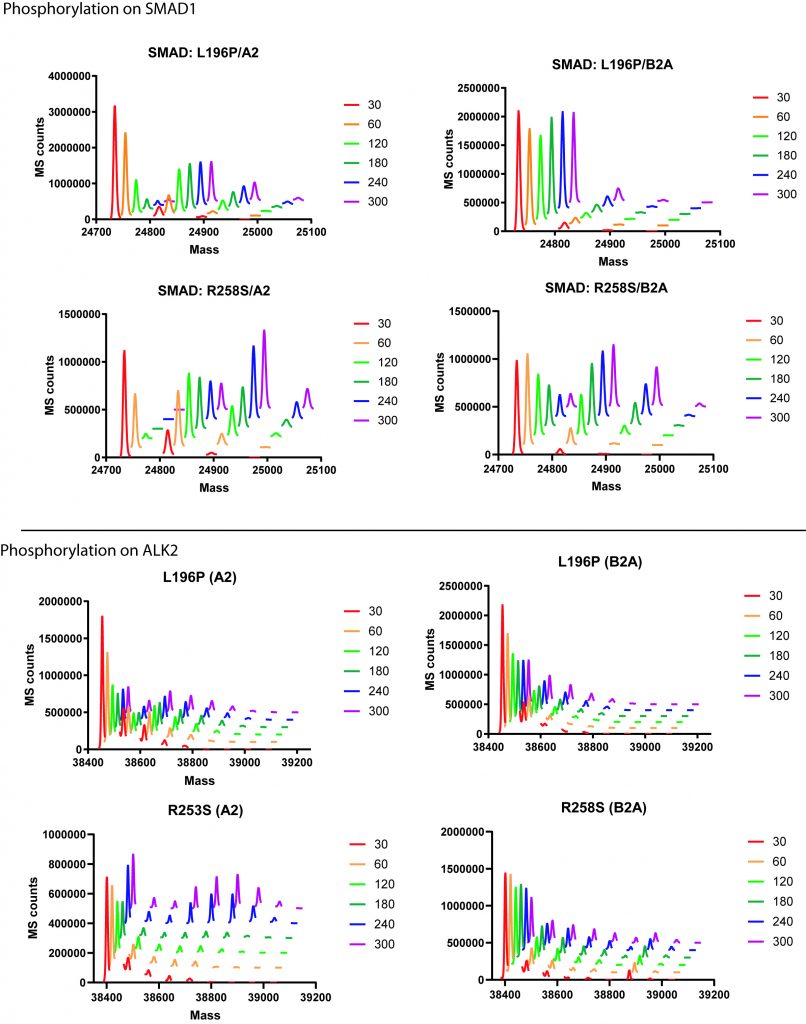
Time course plots for phosphorylation of SMAD1 (top) and ALK2 L196P or R258S (bottom) in the presence of ACVR2 (left) or BMPR2 (right). Legend shows time point in seconds.
Overall we can see that R258S appears to be more activating than L196P with both more SMAD activation over the first five minutes (including the appearance of a potentially interesting third SMAD binding site). This is the case when using either ACVR2 or BMPR2. Also in general ACVR2 appears to lead to more SMAD activation than BMPR2 regardless of mutation.
When looking at ALK2 phosphorylation, we can see that L196P is quickly phosphorylated up to three times compared to R258S but that over the course of five minutes, R258S accumulates up to 6 phosphorylation’s much more rapidly than L196P. This effect is most pronounced when paired with ACVR2.
What this means in very broad terms is that the different ALK2 FOP mutants are differently activating and that their response to different type II receptors change depending on which mutation is present. This is similar to the results seen with other ALK2 mutants studied previously. This builds towards understanding why the ALK2 FOP mutations leads to increased signalling and thus increased bone formation and exactly what is going on.
Phosphomapping of ALK2 R206H and Q207E:
Another aspect of looking at the phosphorylation of ALK2 and SMAD1 is not just how much it is phosphorylated but also where it is phosphorylated. For this I worked with Rod Chalk in our mass spec department to map the phosphorylation sites present in samples of protein incubated as previously mentioned. In this case I was looking at Q207E and R206H mutants of ALK2 paired with either ACVR2 or BMPR2, all in the presence of SMAD. This suggested that many of the phosphorylations could be traced to the following positions in the GS region of the kinase regardless of ALK2 mutation:
STLADLLDHSCTSGSGSGLPFLVQRTV
However not all these sites are seen at the same time and it is hard to determine which are essential for transmission of signal and ALK2 activation.
Similarly phosphorylation on SMAD1 could be traced to the following common locations at the C-terminal tail of the protein:
TQMGSPHNPISSVS
In this case it is the last three serines in the tail that are able to be phosphorylated and again, are seen with both mutations. Combinations of the three possible sites and all three at once were seen as possibilities within the phosphomapping data.
What this means however is a bit less clear. When considering the time course data from the previous post linked as well as the new mutant time course data and the phosphomapping it seems to suggest that you require multiple (up to 6) ALK2 phosphorylations to get maximal (3 site) SMAD1 phosphorylation and that there are at least this many sites in the GS loop and the region just prior to it.
In order to properly probe the necessity of each of these sites, it is going to be necessary to repeat these mass spec experiments on knock out mutants that remove the phosphorylation sites in various combinations, to really see which are essential for ALK2 activation. These are currently being cloned so hopefully I’ll be able to test them soon.
You can find the technical details for all these experiments over on Zenodo.